
STM32 Wireless LoRa Sensor Network with Node-RED GUI on a Raspberry Pi
The aim of this project is to construct a robust wireless LoRa sensor network using STM32 NUCLEO-WL55JC1 dev boards. The boards use demo code which has been adapted using STM32CubeIDE to transmit and log Air Quality data from additional sensors connected to the boards. The data is then formatted and displayed on a user friendly GUI using Node-RED running on a Raspberry Pi.
This project uses the LoRa physical layer which defines how data is transmitted and received over radio waves using a specific modulation technique called chirp spread spectrum. This allows for long-range and low-power communication. The technology and mathematics behind LoRa are explored in ref [2].
Network Architecture
The wireless LoRa network comprises a concentrator node and up to 14 sensor nodes, all using STM32 NUCLEO-WL55JC1 dev boards (see network.png). Each sensor node measures on-board temperature and voltage, as well as air quality using an external MQ-135 sensor module, but any other analogue sensor could be used, and there are spare ADC channels available for additional sensors.
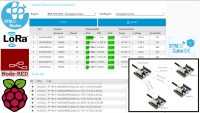
The concentrator node gathers and logs data from the sensor node(s) over a wide area (up to a few square kilometers) and is connected to a Raspberry Pi running Node-RED which is used to format and display the received data on the GUI (see sensornetgui.png).
Required Hardware
- At least 2 x STM32 NUCLEO-WL55JC1 dev boards https://www.st.com/en/evaluation-tools/nucleo-wl55jc.html
- Additional analogue MQ-135 Air Quality sensor module(s) or other analogue sensor(s) for each sensor node.
- A Raspberry Pi4 with attached keyboard, mouse and display on which to run Node-RED
- A x86/AMD64 based system to run STM32CubeIDE for editing and building the source code and flashing the dev boards with concentrator or sensor node firmware. At time of writing the STM32CubeIDE does not run directly on ARM64 systems such as the Raspberry Pi
- 3D Printed enclosures for all nodes (see case.zip containing STL and FreeCAD files). The design was adapted from https://www.thingiverse.com/thing:3594255 by adding a hole for the antenna.
Required Software
- STM32CubeIDE Integrated Development Environment for STM32 https://www.st.com/en/development-tools/stm32cubeide.html
- STM32CubeWL STM32Cube MCU Package for STM32WL series https://www.st.com/en/embedded-software/stm32cubewl.html
- Node-RED https://nodered.org/docs/getting-started/raspberrypi
- PuTTY running on a Raspberry Pi or other computer https://www.putty.org/
In addition to all the resources available through the links above, ref [1] is an excellent introduction to the STM32CubeIDE and to programming STM32 Nucleo development boards in general.
Sensor Node(s)
The Sensor Network can have up to 14 sensor nodes based on STM32 NUCLEO-WL55JC1 dev boards, each equipped with an external MQ-135 Air Quality sensor module to gather air quality data (see sensor.jpg). The air quality sensor module is connected to Analogue AO on the STM32 NUCLEO-WL55JC1 dev board and the LocalNetwork_Sensor demonstration code provided in the STM32CubeWL MCU firmware package has been developed to include the air quality data in the transmitted data packet.
In file main.c the data structure that holds the sensor data and the callback function were both updated to include air quality data from the external sensor
static DEMO_data_1_0_t data =
  {
      .temperature      = DEMO_DATA_1_0_ERROR_TEMPERATURE,
      .voltage          = DEMO_DATA_1_0_ERROR_VOLTAGE,
      .airquality       = DEMO_DATA_1_0_ERROR_AIRQUALITY,
  };

static void WriteDataCallback(void)
{

data.voltage = SYS_GetBatteryLevel()/50;
data.temperature = (SYS_GetTemperatureLevel()*100)>>8;
data.airquality = SYS_GetAirQualityLevel();

SENS_WriteSensorData(&data);
}
In file demo_data_format.h the data structure type definition was updated to include air quality data
typedef __PACKED_STRUCT
{
  int16_t temperature;  /**<Temperature [0.01 `C]*/
  uint8_t voltage;      /**<Voltage on the MCU [0.05 V]*/
  uint8_t airquality;   /**<Air Quality*/
} DEMO_data_1_0_t;

/**Error values for DEMO_data_1_0_t*/
#define DEMO_DATA_1_0_ERROR_TEMPERATURE       INT16_MAX
#define DEMO_DATA_1_0_ERROR_VOLTAGE           UINT8_MAX
#define DEMO_DATA_1_0_ERROR_AIRQUALITY        UINT8_MAX
In file adc_if.c a new function was added to return the air quality reading from the external sensor.
uint16_t SYS_GetAirQualityLevel(void)
{
  uint16_t airqualityLevelmV = 0;
  uint32_t measuredLevel = 0;

  measuredLevel = ADC_ReadChannels(ADC_CHANNEL_5);

  airqualityLevelmV = measuredLevel * 3300/4095;

  return airqualityLevelmV;
}
In file adc_if.h a declaration for the above function was added.
uint16_t SYS_GetAirQualityLevel(void);
In file demo_sensor.c a line was added to print the data being sent on the console (this line is optional but was very useful for debugging purposes to check operation of individual sensor nodes).
APP_LOG(TS_ON, VLEVEL_M, "Data to send, Temperature = %i, Voltage = %i, Air Quality = %i \r\n", Data->temperature, Data->voltage, Data->airquality);
All the code files that were changed are available in the attachments (see code.zip) and on GitHub. https://github.com/mi0iou/LoRa_Sensor_Network
Data relating to the state of a sensor node and its activity is available via a terminal program such as PuTTY running on a computer connected to the USB port on the sensor node (see sensor-com.png). A baud rate of 9600 bps should be used with 8 data bits, 1 stop bit, no parity and no flow control.
On startup, or after pressing the onboard Reset button, a sensor node starts scanning for a signal from the concentrator node. When Beacon and Sync signals are received from the concentrator node the sensor node transmits a packet of data to the concentrator node on the specified frequency and in a specified time slot. After transmission is completed, the sensor node waits for another Beacon and Sync signal from the concentrator node before transmitting another data packet. This cycle is repeated indefinitely every 16 seconds.
Battery Powered Sensor Node
The possibility of powering sensor nodes using batteries was also considered. The easiest way to achieve this was to simply run the sensor node from a portable USB power bank. Alternatively there's just enough room to insert a slim 1000mAh lithium cell into the base of the enclosure along with a charging module and a buck/boost power supply board to provide a constant 3.3VDC output to the dev board (see batterypack.jpg). This enabled the sensor nodes to be truly wireless and to be located in remote areas up to a kilometer away from the concentrator node. (see wirelesssensor.jpg).
However, please note that power consumption of the dev board was much higher when using the additional external air quality sensor (approximately three times higher when idle and about 50% higher when transmitting data). Without the external air quality sensor, and when running from a metered USB power supply, the sensor dev board drew a current of approximately 40mA @ 5VDC when "idle" but running, rising to about 180 mA @ 5VDC when actually transmitting. Duty cycle was well under 5% but would depend on the size of each transmitted data packet. The single 1000mAh battery lasted a few days before needing recharging. Power consumption would be less running on battery than USB, because the debugger circuitry on the dev board is not powered up when running directly on 3.3VDC via PIN4 of CN6.
Concentrator Node
The concentrator node (see concentrator.jpg) is based on a STM32 NUCLEO-WL55JC1 dev board which communicates with the sensor nodes to sync data transmission and collect data. The LocalNetwork_Concentrator demonstration code provided in the STM32CubeWL MCU firmware package has been developed to read and process the amended data packet (which now includes air quality data) from the sensor nodes.
In file demo_report.c air quality is appended to the data read from the USB (serial) port
static void Report_1_0_RCV(const DEMO_data_1_0_t *Data, uint32_t DataLen)
{
  bool voltage_present = true;

  /*Temperature*/
  if (CheckAndUpdateLength(&DataLen, sizeof(uint16_t),
                           Data->temperature == DEMO_DATA_1_0_ERROR_TEMPERATURE, "E,") == true)
  {
    APP_PPRINTF("%+hi.%02hu,", Data->temperature / 100, CONC_ABS_INT(Data->temperature % 100));
  }

  /*Voltage*/
  if (voltage_present == true)
  {
    APP_PPRINTF("%u.%02u,", Data->voltage / 20, (Data->voltage % 20) * 5);
  }
  else
  {
    APP_PPRINTF("E,");
  }

  /*Air Quality*/
  APP_PPRINTF("%u\r\n", Data->airquality);

}
All the code files that were changed are available in the attachments (see code.zip) and on GitHub https://github.com/mi0iou/LoRa_Sensor_Network
Commands may be issued to the concentrator node and data received from it via a terminal program such as PuTTY running on a computer connected to the USB port on the concentrator node, or via the Node-RED GUI. If using PuTTY, a baud rate of 9600 bps should be used with 8 data bits, 1 stop bit, no parity and no flow control.
On startup, or after pressing the onboard Reset button, the concentrator node waits for instructions. A list of available commands may be obtained by typing “AT?” and pressing Enter. Entering command “AT+LIST_REGIONS” will list available regions and sub regions. These should be set according to your location (eg European Union).
Entering command “AT+BEACON_ON” activates the concentrator node to start transmitting. It will start transmitting Beacon and Sync frames every 16 seconds on the allocated frequency according to the selected region and subregion. The Beacon frames are mostly preamble so that the sensor nodes can find the network. The Sync frames provide more information about the network, including coding rate and modulation parameters for the sensor nodes. A screenshot of transmitted beacon and sync signals as shown on the HackRF Portapack Looking Glass app is included in the attachments (see waterfall.png).
Sensor node(s) within range will reply to the concentrator node with a packet of data. The concentrator node software reads this data packet and then sends the received data to the USB (serial) port on the concentrator node in the following format:
- sensor’s EUI (eg 0x000a9f02)
- hexadecimal counter which is incremented every time a packet of data is received (eg 0x00)
- software version (eg 1:0)
- RSSI (eg -13)
- SNR (eg 6)
- Temperature (eg +20.00)
- Voltage (eg 3.30)
- Air Quality (eg 130)
Node-RED Graphical User Interface (GUI)
The GUI uses Node-RED running on a Raspberry Pi4. The Raspberry Pi was chosen because the system running Node-RED would have to be running 24/7, and the Pi's low power consumption made it an obvious choice. It also made it convenient to use a TV as a display using a HDMI cable, and the TV does not have to be on all the time.
The .json file for the GUI (which can be imported into and "run" on Node-RED) is provided in the attachments (see SensorNetGUIv1.zip) and on GitHub https://github.com/mi0iou/LoRa_Sensor_Network
This archive contains the Main flow (see mainflow.png) and the Serial Flow (see serialflow.png). Once imported into Node-RED the GUI dashboard may be accessed by pointing the web browser on the Raspberry Pi to nodered.local:1880/ui
The GUI was designed to present and display the sensor data in table format and also show the raw data coming out of the concentrator's USB (serial) port (see sensornetgui.png). Note that this screenshot shows the sensor network running with seven sensor nodes connected for over 6 days, with each sensor node having sent over 36,000 data packets with few if any missed data packets.
Network Performance
As noted above, the network performed well and while the Node-RED GUI was running, missed very few if any data packets from the remote sensor nodes, which were deployed (and operational now for a few weeks) in a farm setting, measuring air quality and temperature in various locations where (for example) livestock are housed, feed is stored, and electrical switchgear located, and (literally) out in the field at distances up to one kilometer.
The sensor network was found to be very stable and robust and recovered well from temporary loss of power and/or signal for either sensor or concentrator nodes and performed well with up to the maximum of 14 sensor nodes. When all 14 available sensor node time slots are occupied, any additional sensor nodes trying to join the network wait until one of the existing sensor nodes is lost and times out before joining. This behavior would be very useful if the sensor nodes were mobile and travelling in and out of range of the concentrator node.
Key Features
- Long-range communication: LoRa modulation enables coverage over large areas
- Low power consumption: Maximizes sensor node battery life.
- Scalability: Easy to expand the network with additional sensor nodes.
- Flexibility: Adaptable to various sensor types and applications.
- User-friendly data visualization: Node-RED GUI simplifies data logging and analysis.
Potential Applications
- Environmental monitoring: Track air quality, temperature, humidity, and more.
- Smart agriculture: Monitor soil moisture, crop health, and irrigation needs.
- Asset tracking: Locate and monitor valuable assets in real-time.
- Industrial automation: Collect data from remote machinery and equipment.
- Smart cities: Gather data for intelligent traffic management and resource optimization.
References
[1] D. Ibrahim, Nucleo Boards Programming with the STM32CubeIDE, Elektor 2020.
[2] Visual Electric, “How LoRa Modulation really works - long range communication using chirps”, https://youtu.be/jHWepP1ZWTk?si=T5I4qjMa7G74bDEW
Discussion (3 commentaire(s))